2.8 Creating a Tag List
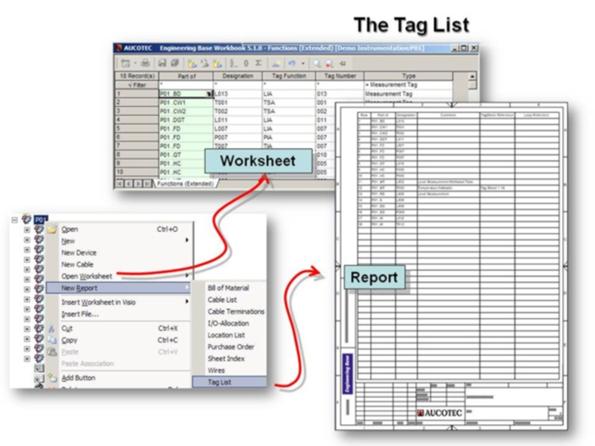
Once the P&I diagram has been created in Engineering Base and all measurement tags have been defined, the data can be output to worksheets or via so-called reports.
A worksheet is an online list similar to those in EXCEL; it can be used to quickly and efficiently edit the existing data.
By contrast, a report is the linkage between a worksheet and a drawing sheet; this means that the online list is graphically displayed in the drawing sheet.
Engineering Base by default offers a number of templates for outputting lists as worksheets or reports.
However, the main point is that all worksheets and reports are associated with each other online, i.e. changes made at one point are consistent within the entire project.
How to create a tag list with a report
1. Click on the folder Documents.
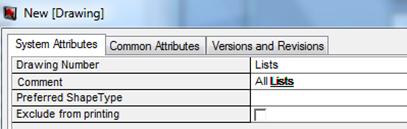
2. Use the context menu to create a drawing with the name Lists.
3. Now switch over to the folder Functions and there select the plant P01.
4. Then execute the function New Report / Tag List in the context menu.
5. In the dialog that is now displayed, use the button on the right of the first line to select the drawing folder Lists.
6. Delete the entry in the line Sheet Designation; the comment is then used as sheet designation (Tag List).
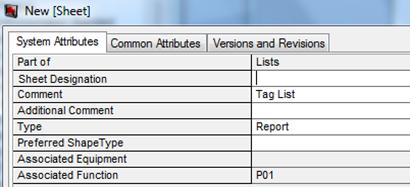
7. Confirm your entries with OK; the tag list is created under the folder Lists.
8. Once the tag list exists, it is tracked when tags are entered or changed.
Tipp: Always print the reports via Engineering Base because a report may contain more data than is shown in Visio.